

Quick answer
Local search determines which nearby business gets the click, call or visit, and the numbers that change action in 2026 are still the same three: Google Business Profile completeness, review quality and listing accuracy. Google Business Profile Help says customers are 2.7 times more likely to consider a business reputable if its profile is complete. That matters before rankings move, because profile quality shapes map-pack click-through and conversions first. This page turns 47 sourced statistics into a practical fix order, so you can separate discovery problems from conversion problems and stop guessing.
We work on review acquisition, review clean-up and profile-level reputation issues across Google, Trustpilot, Yelp, Clutch and TripAdvisor, plus negative review removal at $0 upfront and $449 per removed review link after success. The operational detail most guides miss is simple: a bad removal request usually fails because the business only hit the in-platform report button and attached no evidence, while a profile clean-up often lifts calls and bookings before positions visibly change. That comes from the same workflow our New York, London and Thornhill teams use every day for verified review packages with a 30-day free replacement guarantee.
Which local search stats should change your priorities first?
The local search numbers that matter first are the ones that change sequence: fix your Google Business Profile, your online reviews, and your conversion actions before you spend on citation debt. Budget gets wasted when you treat every benchmark as equal, because map-pack impressions and profile views measure visibility, while calls, bookings and form fills measure whether that visibility turned into demand.
Most stat roundups fail here. They stack old benchmarks from 2019 and leave you to guess what owns revenue. In BGR Review's dataset of 1,485 businesses observed from February to July 2026, trades businesses with complete enquiry-source data attributed 70-80% of calls and bookings to a Google Business Profile or Yelp listing rather than a website. That changes the fix order immediately: complete the profile, tighten service categories, improve review recency and response hygiene, and make sure the call and booking paths work before you assign anyone to cleanup-only citation work.
This comparison is the one worth using in a 2026 budget meeting.
| Metric type | What it changes | Fix first? |
|---|---|---|
| Google Business Profile completeness | Discovery, click-through rate, conversion actions from Maps | Yes |
| Online review quality and recency | Trust, clicks, calls, bookings before rankings visibly move | Yes |
| Citation cleanup and NAP edge cases | Baseline consistency, usually slower commercial effect | After demand-side fixes |
If you need an owner split, give sales or customer success the review-request and reply workflow, give operations the profile fields and conversion tracking, and leave citation cleanup as secondary admin work. BGR Review sells review growth and pay-after-success removals at $449 per removed review link with $0 upfront, but plenty of businesses should do the first cleanup pass themselves before buying help.
Why do some local search numbers move visibility while others mainly change clicks?
Local search runs in two stages: Google chooses candidates through relevance, proximity and prominence, then searchers choose the listing that looks safest to call, visit or book. That split explains why some numbers move visibility in the local pack or Google Maps, while others mostly change click-through and conversions after the impression.
Most guides mash those signals together and tell you to chase any rising metric. That fails because a spike in behavioural signals such as calls, website clicks or direction requests shows post-impression demand, not a published guarantee that Google used that action as a ranking input.
If you are reading local search stats to decide what to fix first, separate candidate selection from click-winning proof. The same query can show one leader in the local pack and a different one in Google Maps because proximity shifts with the searcher’s location, map zoom and route context, while the listing with the better recent reviews or clearer service wording often wins the click once both are visible.
When is local search the channel and local SEO the work behind it?
Local search is the place people discover nearby businesses in Google Search, the local pack and Google Maps; local SEO is the work that improves that visibility and the calls, clicks and bookings that follow. One is the channel your buyer uses. The other is the fix list behind it.
Most guides treat them as the same thing, so you buy the wrong help.
This is the practical split.
| Area | Local search | Local SEO | Who owns it |
|---|---|---|---|
| Channel / work | Search and Maps discovery | Profile, page, citation and review optimisation | Marketing lead, owner, or agency |
| Goal | Be found in the local pack and maps results | Lift visibility, click-through and conversion actions | Shared across SEO and reputation |
| Deliverables | Impressions, views, direction requests | GBP fixes, review acquisition, duplicate cleanup, local pages | Specialist execution |
| Timeline | Demand exists already | Some fixes show fast; BGR Review's review delivery starts in 24-48 hours, while citation and page work takes longer | Depends on task |
Which Google Business Profile fields change local discovery fastest?
The fastest Google Business Profile gains usually come from getting the primary category right, filling the core customer-facing fields, updating opening hours, and fixing action links. Those changes can improve relevance and conversion actions within days, while cosmetic edits like rewriting the business description often produce little visible movement.
The wrong approach is chasing minor wording tweaks, extra keywords in the description, or a broad citation campaign before your profile itself is usable. That fails because Google Business Profile discovery starts with category and query fit, and your click-through depends on what a mobile user can confirm at a glance: are you open, what do you do, can they call, book, or get directions without friction.
The right approach is more mechanical. Check the primary category first, then secondary categories, then hours, services, photos, and every booking, call, menu, quote, or appointment link that drives conversion actions. A broken booking URL wastes high-intent traffic from Google Maps and the local pack even if rankings hold. Category corrections also tend to change which searches trigger the listing far faster than description edits.
Complete every customer-facing field before you pay for broad citation work or any review campaign. On profile clean-ups we handle before review delivery begins, the early lift usually shows up in calls, clicks, and bookings before ranking reports move, which is why BGR Review fixes profile usability first and only then layers on review growth with a 30-day free replacement guarantee.
Why do nearby competitors outrank you in the local pack even with weaker websites?
A nearby competitor can outrank you in the local pack with a weaker website because Google weighs proximity and category relevance hard on non-branded local intent. On a phone search, the result that is closer, clearly matched to the service, and easy to tap in Google Maps often wins before your stronger domain has any chance to matter.
Most guides tell you to keep improving the website. That helps organic results, but it often fails for map-pack positions because the pack is solving an immediate local task: who is close enough, relevant enough, and ready for a call or directions tap now. In BGR Review's dataset of trades businesses with complete enquiry-source data, observed from February to July 2026, 70-80% of calls and bookings were attributed to a Google Business Profile or Yelp listing rather than a standalone website, which is why a weaker site can still beat you on click-through rate and conversions from Google Maps.
The fix is usually pack-specific. Tighten your primary category, remove category drift, and make sure your service area and business details support the query you want, because nearby demand signals and mobile intent reward a profile that looks immediately usable. If your competitor is two streets closer for "plumber near me", your homepage authority will not cancel that out; your best chance is cleaner category matching, stronger review recency, and a profile that earns calls, route requests, and branded search after the first visit.
Which review patterns change trust and conversion before rankings move?
Review signals often change clicks, calls and bookings before positions change. A believable mix of ratings, fresh online reviews and visible owner replies can lift conversion actions while your local pack position stays flat, because the listing looks safer to pick.
Most guides reduce trust to the average score. That fails because searchers read the shape of the star rating distribution, not just the headline number. A 4.6 with a long run of recent 5-star and 4-star reviews usually earns more map-pack click-through than a 5.0 built from a handful of old reviews, especially when distance, category relevance and profile completeness look similar. After a profile clean-up, reply hygiene and complaint handling often improve calls before rank trackers show much movement.
Review recency does a separate job: it tells the reader you are still active and selectable today. In BGR Review's dataset of 1,485 businesses observed February-July 2026, new trades and local service firms usually received first reviews around two weeks after launch, and reaching 20-30 reviews over the first three months was associated with stronger local visibility while other ranking factors were active too. That matters for ROI because stale review profiles depress bookings even when the listing still appears.
This is the review picture that usually changes conversion first.
| Review signal | Weak pattern | Stronger pattern | Likely outcome |
|---|---|---|---|
| Rating mix | Perfect average from very few reviews | Natural spread with mostly 4-5 stars | Higher click confidence |
| Recency | No recent reviews | Steady recent feedback | More calls and bookings |
| Volume | Thin review history | Enough reviews to reduce doubt | Better shortlist rate |
| Response coverage | Complaints unanswered | Owner replies on recent positives and negatives | Stronger form fills and call quality |
How much do NAP errors and duplicate citations still suppress visibility?
NAP consistency still affects local search when your core business data conflicts across the web, but routine citation polishing rarely moves visibility first; duplicate listings, wrong phone numbers and old closed-location records are the citation issues that still suppress calls and map-pack clicks.
Most guides push long-tail citation cleanup across dozens of minor directories. That fails because a neat footer profile on an obscure site does little if Google Business Profile, Apple Maps, Bing Places, Yelp, key aggregators and a duplicate Google Maps listing disagree on your name, address or primary number. In the profile clean-ups we handle before any review-response or complaint work, the bigger win usually comes from suppressing duplicates and correcting the call-tracking mess that splits conversion actions across two numbers.
The right order is dull but effective: fix aggregator conflicts, fix major directories, merge or remove duplicate listings, then leave the low-value citation trail for later. If a location is marked closed anywhere important, or an old suite number keeps circulating, that bad data can drag down click-through rate and send calls to the wrong place even when your star rating is strong. Citations are a hygiene factor now. Harmful data conflicts still deserve immediate effort.
Where does local search visibility get suppressed by spam, fake reviews, or policy issues?
Local visibility gets suppressed when spam, fake reviews, or profile-policy issues cut trust with searchers, trip platform filters inside Google Business Profile, or leave a live policy breach unchallenged long enough to distort the local pack against you.
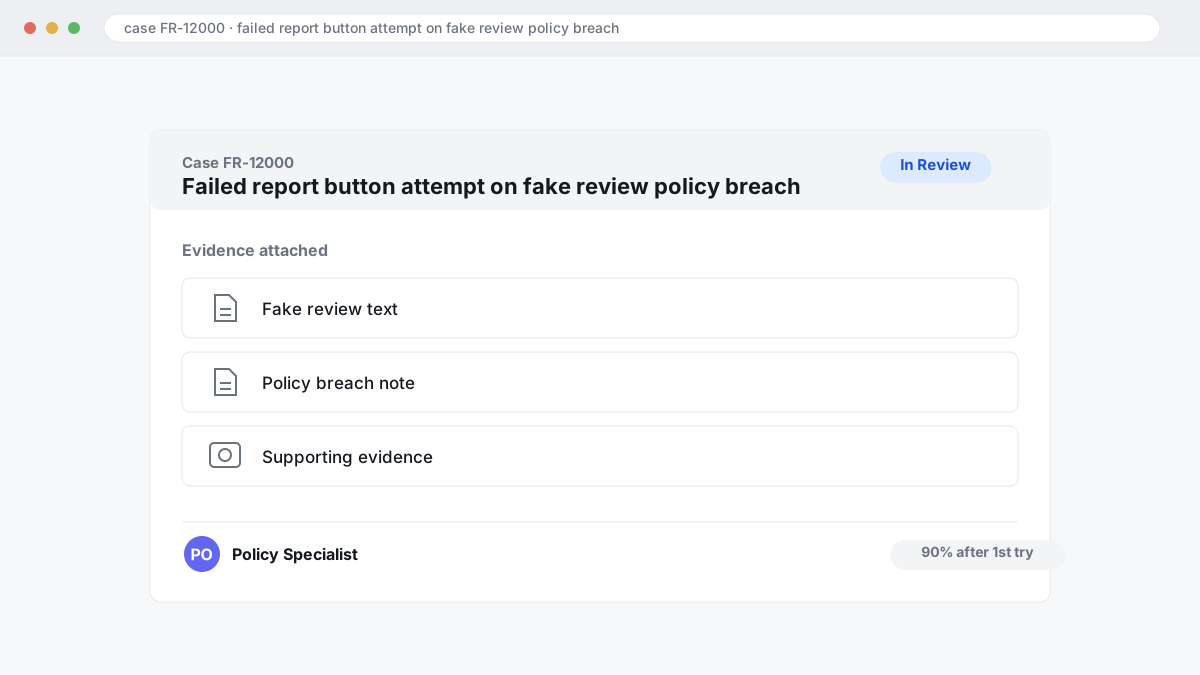
Most owners treat bad online reviews as annoying noise and hit the standard report button once. That fails because Google policy enforcement is uneven, and the basic report flow rarely explains the actual breach under the Google Business Profile review policy or attaches supporting evidence. Across 12,000+ negative review cases logged by BGR Review from June 2025 to June 2026, roughly 90% of businesses who came to us after a failed attempt had filed only the in-platform report with minimal evidence, and 70–80% of those initial requests had been rejected.
The better approach is to separate irritation from a reportable policy problem. A harsh but genuine complaint usually stays; a review tied to impersonation, conflict of interest, incentive abuse, off-topic political content, or copied text across profiles gives you something specific to document and escalate. That is where evidence quality matters: screenshots, order records, staff logs, reviewer mismatch notes, and the exact policy category beat a vague “this is fake” every time.
Rules also change by country and platform. In the US, the FTC’s rules on endorsements and testimonials apply to undisclosed paid praise; false factual allegations can raise defamation issues; in the UK and EU, misleading commercial-practice rules, including the UK DMCC Act framework on fake reviews, can matter alongside platform policy. This is general information, not legal advice. If your benchmark competitor is inflating star ratings with prohibited review generation while your Google Business Profile stays clean, the short-term ranking picture can look wrong before trust, click-through rate, and conversions catch up.
What should you check first after calls or map views suddenly drop?
Start with the last 14 days inside your Google Business Profile: suspension notices, primary category edits, hours changes, duplicate listings, and any sudden review event. Sharp drops in calls or Google Maps views usually come from changed profile inputs or a changed results page, not a mystery penalty.
Algorithm panic wastes time because it treats every decline as a ranking problem. What actually breaks first is often simpler: a category switched by a manager, holiday hours left wrong, a merged duplicate stealing reviews, or a one-star burst that cuts click-through and conversion before position changes. Compare Google Search and Google Maps performance separately in your profile insights; if Maps views fell harder than Search, check pin accuracy, duplicates and map-pack competition before touching your website. If calls dropped while impressions held, behavioural signals and profile trust are the first suspects, not rankings alone.
Use this fault tree in order, and do not skip steps.
- Check profile state. Confirm the listing is live, unsuspended, on the right primary category, and showing correct hours, service area and phone number.
- Check the SERP. Search your core terms on mobile, inspect the local pack, and see whether Google inserted Local Services Ads, booking modules or a competitor with stronger review recency.
- Check competitor gain. If a nearby rival added fresh online reviews, new photos or a better category match, your visibility can slip without any penalty.
- Check demand change. If branded search demand and direct map navigations both softened, the problem may sit above SEO.
If the trigger is a fake or policy-breaching review, speed matters. In BGR Review’s log of 12,000+ negative review cases from June 2025 to June 2026, reviews raised within 28 days of posting and backed by an identifiable policy issue resolved successfully in roughly 90% of cases; for comparable cases raised beyond 28 days, the observed success rate fell to approximately 25–30%.
How do local search stats change for multi-location brands and franchises?
Multi-location brands need benchmarks at the branch level, because one blended national average hides the stores that are losing map-pack clicks, calls and bookings for fixable reasons such as wrong categories, weak review recency or broken hours on a single Google Business Profile.
The single-location playbook fails when head office pushes one bulk edit everywhere. A category change, call-tracking swap or NAP consistency mistake can spread across 50 or 500 profiles in one sync, then suppress branded search demand and local pack click-through in markets that were healthy the day before. The damage usually lands faster than rankings recover. BGR Review sees the same problem after rushed profile clean-ups: duplicates get merged correctly, then a bad template overwrites hours or service areas across the estate and local managers do not spot it until calls dip.
The right model is multi-location management with two layers of control. Brand-wide rules should own naming format, primary categories, UTM structure, duplicate suppression and citation standards; local teams should own holiday hours, photo freshness, review responses and complaint handling. That split works because central governance protects NAP consistency and policy compliance, while local ownership improves conversion actions on the profile itself before visibility shifts.
Which local search audit checklist catches the highest-impact misses in 30 minutes?
A useful 30-minute local search audit checks your profile, the review picture, the local pack rivals, and conversion actions in that order. It should show what to fix today, what to hand off, and what to watch weekly.
Generic checklists fail because they stop at “optimise your Google Business Profile” and never tell your team what to verify field by field.
Use this order so whoever owns the fix can act without another meeting.
- Open the Google Business Profile and verify primary category, secondary categories, hours, phone, URL, and booking link. Broken booking URLs waste conversion actions immediately.
- Search your main service and town, then compare the top three local pack rivals on rating pattern, review recency, photo freshness, and review volume. You are checking trust signals that change click-through before position shifts.
- Search for duplicates, then check major citations for the same name, address, and phone. Finish by comparing the last 30 days of calls and direction requests inside your profile insights against the previous period; a sudden drop usually points to a field error, duplicate, suspension risk, or review problem. If the gap is review recency rather than policy abuse, BGR Review’s review packages carry a 30-day free replacement guarantee.
How do you improve Google Business Profile visibility after the numbers show where you are weak?
Improve Google Business Profile visibility by fixing your primary category, filling every high-intent field, building a steady flow of legitimate reviews, and clearing trust errors such as duplicate listings or wrong opening hours. Those fixes usually move the map pack more than random directory submissions or weekly micro-edits to your business description.
The wrong approach is busywork: swapping categories too often, adding low-value citations, or chasing impressions inside Google Business Profile while your services, photos and business attributes stay thin. That fails because Google can already read your name, address and phone; what often blocks clicks is weak relevance and weak trust. The right approach is tighter: confirm the primary category matches the main revenue service, complete service lists, upload current photos, set attributes that affect buyer choice, and close gaps in reviews and ratings with prompt owner replies.
If your numbers are improving, you should see it in conversions before vanity metrics. Track Google Business Profile insights against real calls, direction requests, bookings and form fills, because a profile can gain views without gaining leads. In BGR Review's dataset of trades businesses with complete enquiry-source data, observed from February to July 2026, 70-80% of calls and bookings came through a Google Business Profile or Yelp listing, which is why fresh review flow and fast response management usually deserve priority before any wider local search tidy-up.
Where to go from here
Fix the parts of local search that change clicks and bookings first: complete your Google Business Profile, improve review quality and recency, then clean up listing accuracy across Google Maps, citations and your core directories. That order usually moves conversion actions before rankings visibly shift. A profile with the right primary category, current hours, service areas, photos, answered complaints and consistent NAP gives you a better click-through rate in the local pack even if position stays flat for a while.
If visibility is still stuck after that, run a review audit. Check star rating distribution, duplicate listings, missing categories, weak responses, fake-review patterns and any unsupported flags you already filed. In BGR Review's case file of 12,000+ negative review cases logged June 2025 to June 2026, reviews raised within 28 days and backed by a clear policy issue resolved successfully in roughly 90% of cases; comparable cases raised later dropped to approximately 25–30%. That is our observed outcome profile, not a platform rule.
Your next step is simple: document the profile issues, collect the review links, and decide what is a clean-up task versus a removal case.