


Quick answer
Google does not publish a public review-ranking formula, but reviews clearly affect local pack visibility and click-through through several separate signals. On a Google Business Profile, review volume, review recency, star-rating distribution, text detail, owner responses and spam filtering all shape performance alongside Google’s local factors of relevance, distance and prominence. A perfect average alone rarely carries the result. For removals, Google applies its Maps user-contributed content policy, and the deciding factor is evidence matched to a specific policy breach, not whether the review is harsh or commercially damaging.
This page is written from live reputation work, not recycled local SEO advice. We handle review growth and removals every week, and the pattern is consistent: a profile can gain map-pack clicks from fresher, better-written reviews before its average rating changes much, while a removal request usually fails if it relies only on the in-platform report button with no evidence pack behind it.
Across 12,000+ negative review cases logged June 2025 to June 2026, our records show why timing matters: reviews raised within 28 days and tied to an identifiable policy issue resolved successfully in roughly 90% of cases, while comparable cases raised later fell to approximately 25–30%. We also sell these services openly, so where the cheaper DIY route makes sense, or where Google will almost certainly refuse, we say that plainly.
Why does this study split visibility, clicks, filtering, and removals instead of treating reviews as one signal?
Google reviews do not act as one unified lever. They affect at least four separate systems inside a Google Business Profile: local pack visibility, click-through rate, review spam filtering, and policy-based removals, so the right fix depends on which result is failing.
Thin guides flatten all of that into “reviews help SEO”, then tell you to chase a higher star average. That fails because the same profile can hold position, gain clicks, lose published reviews to filtering, and fail a removal request at the same time. A 4.8 average is the cleanest example: it can improve map-pack click-through rate because searchers trust the listing more, while the local pack order barely moves because distance, relevance, category fit, and profile completeness still outweigh a small rating change.
The useful diagnosis is separate. If visibility drops, you inspect review volume, recency, category match and the rest of the Google Business Profile signals tied to local ranking. If reviews vanish before publication, that points to review spam filtering rather than a ranking issue. If a bad review stays live, that is a removal question under Google Maps user-contributed content policy, not proof that Google “counted it” as a ranking signal. Across 12,000+ negative review cases logged by BGR Review from June 2025 to June 2026, outcomes were tracked as removal success, unresolved, or unknown, because a filtering problem and a policy-removal problem are different jobs.
How do Google reviews influence local pack rankings in practice?
Google reviews influence local pack rankings by strengthening prominence signals and query context inside Google’s relevance, distance and prominence balance, rather than by star average alone. Their effect is strongest when recent review text, service terms, and a complete Google Business Profile all point at the same service in the same place.
Most guides reduce this to “get more 5-star reviews and you rank first”. That fails because local pack rankings do not work as a star leaderboard. A profile with a 4.9 average can still sit below a 4.6 profile if the lower-rated listing is closer to the searcher, matches the query better, and carries stronger prominence signals through review volume, review recency, category fit, photos, services, and a fully built Google Business Profile.
Review text matters because Google can read context from it. If your recent reviews mention “emergency boiler repair in Croydon” or “same-day denture repair in Leeds”, those details can reinforce service and location relevance in a way that a bare “Great job” never will. That does not mean stuffing keywords into review requests; it means earning genuine detail from real customers and keeping your services, categories and business description aligned so the profile sends one consistent signal.
If you change nothing except reviews, rankings usually move slowly or barely move at all inside 7 days. In BGR Review’s dataset of 1,485 businesses observed from February to July 2026, new trades and local service businesses that reached 20–30 reviews over their first three months were associated with improved local visibility, but other ranking factors were active at the same time. That is the useful frame: reviews support prominence, then clicks, calls and branded search demand follow more reliably when the rest of the profile is already credible.
When does review text matter more than the rating you display?
Review text matters most when nearby competitors on Google Business Profile show similar ratings and review counts. Specific language about services, staff, timing or location gives Google clearer relevance signals and gives searchers a better reason to click, while generic praise adds little and can look low-value.
The wrong approach is chasing a cleaner star-rating distribution and assuming the displayed average will do the rest. That fails when ten profiles in the local pack all sit in a narrow rating band, because “Great service” repeated across twenty 5-star posts tells Google very little about what you actually do. Review text quality starts doing more work here: “emergency boiler repair in Croydon”, “same-day brake pad fitting”, or “accountant who fixed our CIS return” helps the profile match service-led searches in a way vague praise cannot.
Most guides flatten this into a star issue. On a live Google Business Profile, mixed-sentiment reviews with detail often win more trust than a wall of identical praise, because a review that says “arrived late but fixed the leak in one visit” reads like a real customer account and can improve click-through rate even if the average stays the same. Short, repetitive wording also runs closer to review spam filtering, especially when multiple posts use near-identical phrasing, timing or service claims. If you are asking customers for reviews, ask for specifics about the job, location and outcome, not adjectives.
How much do recency and volume each matter before a profile starts looking competitive?
Review recency tells Google Business Profile that customers are still choosing you now, while review volume tells it your reputation has depth; both matter, and a profile with three fresh reviews can still look thin beside a rival carrying 300 total reviews in the same local pack.
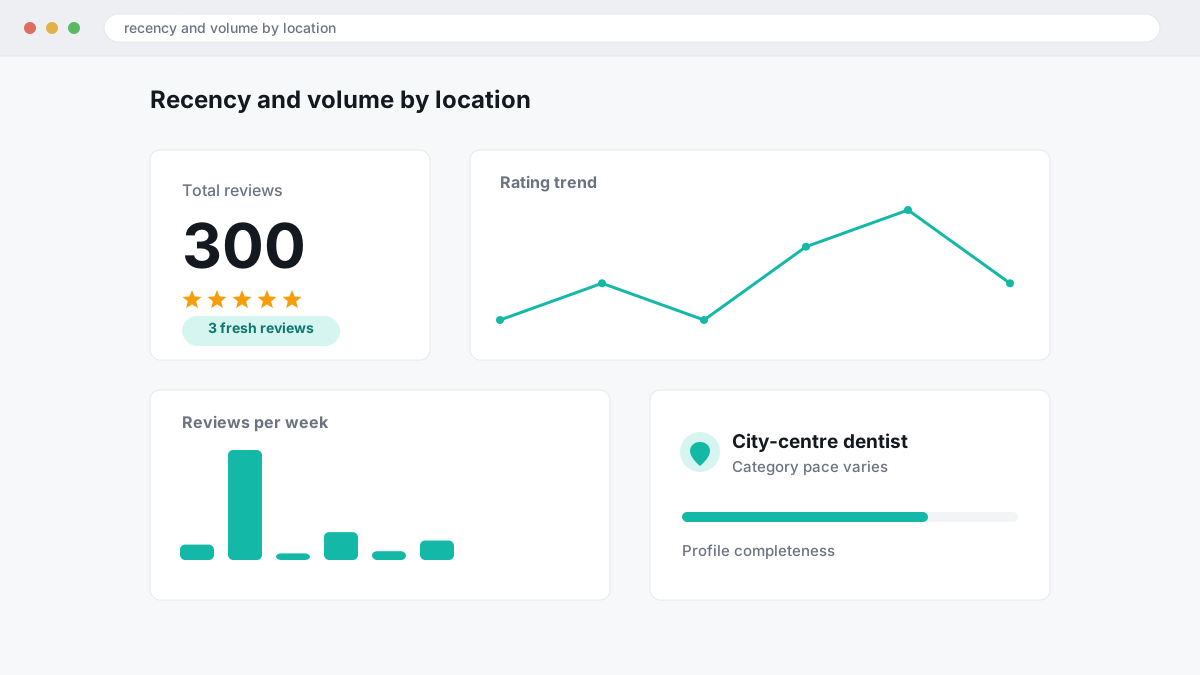
The wrong move is chasing one universal target such as “get 20 reviews” and applying it to every branch. That fails because category pace, seasonality and customer throughput change the benchmark by location: a roofer after storm season, a city-centre dentist and a low-footfall B2B office will not build review volume at the same speed, even if their service quality is identical. In BGR Review’s dataset of 1,485 businesses observed from February to July 2026, established practices such as dentists, lawyers, accountants and roofers typically needed 30–50 reviews before profiles performed consistently, while newer trades often became more visible once they reached 20–30 over the first three months.
The better approach is to set a local baseline for each branch, then protect multi-location consistency so one office does not look active while another looks abandoned. Fresh review recency helps click-through rate and branded search demand because searchers see current activity, but accumulated review volume still carries more market proof when two profiles have similar relevance, distance and profile completeness. If your nearest competitor has 300 reviews, three recent five-star posts are progress, not parity.
Why can stars lift clicks even when they barely move rankings?
Star ratings often change click-through rate faster than rankings move because searchers use visible stars as a trust shortcut. A believable average backed by enough review volume can lift calls, visits and direction requests from a Google Business Profile even when the local pack order barely changes.
The wrong read is that rank determines everything, so a profile in second place should always lose to the one above it. That fails because people scan star-rating distribution and count before they parse small position changes on a phone screen. A 4.7 average from a substantial review base usually looks safer than a fresh 5.0 with only a handful of ratings, especially when both profiles sit in the same pack and offer similar relevance.
The right move is to treat stars as click-share leverage, separate from ranking leverage. In BGR Review's dataset of trades businesses with complete enquiry-source data, observed from February to July 2026, 70–80% of calls and bookings were attributed to a Google Business Profile or Yelp listing rather than a website, which is why a stronger review count can change conversions before it changes position. A lower average can still win the click if the review detail feels real: specific jobs, timelines and owner replies often beat a sparse perfect profile that looks untested.
Which review fixes usually pay back fastest when you cannot do everything at once?
The fastest payback usually comes from restoring review recency, closing obvious response gaps, and removing policy-violating reviews on your most valuable locations first. On a Google Business Profile, those three fixes usually lift trust and conversion sooner than starting a large review campaign across every branch.
The wrong move is to start with the biggest campaign because it feels measurable. That fails when your highest-intent location already ranks reasonably, but looks stale beside competitors with fresh reviews from the last few weeks; extra volume spread across all sites dilutes effort, leaves the weak page weak, and does little for click-through rate or calls. Start with the branch that already gets map visibility, has a small competitor gap, and lacks recent reviews. In BGR Review's dataset of 1,485 businesses observed February-July 2026, new trades and local service businesses that reached 20-30 reviews over the first three months were associated with better local visibility, though other ranking factors were active at the same time.
Your second fix is owner responses on unresolved negative reviews, with a 48-hour standard. A short, specific reply on the Google Business Profile will not erase the complaint, but it changes what the next searcher sees before they call, book or fill a form; unanswered negatives depress trust faster than a slightly lower star average. Keep replies factual, name the issue, offer an offline route, and avoid template language that makes every location look managed from one script.
Third, deal with obvious policy breaches before you spend on broad acquisition. If a review appears to breach the Google Maps user-contributed content policy, escalation usually beats buying more social proof around it; a visible fake or abusive post can drag conversions down even while review volume rises. BGR Review handles removals on a pay-after-success basis at $0 upfront and $449 per removed review link, which is often the cheaper first move than pushing a full campaign into a profile that still has an unresolved policy problem.
Can fake Google reviews hurt rankings, trust, or both?
Fake Google reviews can damage both visibility and trust because Google’s review spam filtering, your visible star-rating distribution, and the customer’s first impression do not move in perfect sync.
Most guides treat fake reviews as a reputation problem. That fails because spam can also distort moderation outcomes: a burst of near-identical five-star posts, reviewer overlap across unrelated profiles, or off-topic text about products you do not sell can trip quality filters, confuse support, and make a legitimate clean-up slower. Google may dampen the weighting of those reviews or ignore some signals internally before it removes anything you can still see on the profile, so your local pack clicks can soften even while the review count looks higher.
The practical approach is to check the pattern before you chase the stars. Compare reviewer names, account histories, posting cadence, and whether the wording fits the category and the Google Maps user-contributed content policy; then document the anomaly as a moderation issue, not just “fake review”. Across 12,000+ negative review cases logged by BGR Review from June 2025 to June 2026, roughly 90% of businesses that came to us after a failed attempt had used only the basic in-platform report button, and 70–80% of those initial requests had been rejected. That is where the support headache starts.
Fake negative reviews create the same problem from the other side. A sudden drop in rating credibility, especially with a lopsided star-rating distribution and vague one-line complaints, can suppress click-through rate and calls before rankings visibly move, which is why removal work at BGR Review runs on $0 upfront and $449 per removed review link only after success.
What should a useful Google review audit checklist actually include?
A useful Google review audit tracks five fields every week: rating, review count, recency, response coverage, and suspicious patterns. Run the same check on your Google Business Profile and your top three local pack rivals so shifts in trust, filtering, and local pack rankings show up before leads drop.
Most guides tell you to watch average stars. That fails because a 4.8 profile with stale reviews, weak owner responses, or repeated moderation losses can lose click-through rate and map-pack visibility to a rival with a lower score but fresher activity. The workable audit compares competitive, behavioural, and moderation signals together, and it keeps exact dates because replacement windows on managed review campaigns, including BGR Review's 30-day free replacement guarantee, depend on when a disappearance happened.
Copy this weekly checklist into your sheet or CRM:
- Your profile: star rating, total count, newest review date, response rate, and removed-review history.
- Top 3 local competitors: track the same five fields side by side.
- Anomalies: duplicate wording across reviewers, location mismatch between review text and service area, and unexplained review disappearances.
- Multi-location consistency: compare each branch separately so one weak location does not hide behind a stronger head office profile.
What actually happens after you flag a review and Google does nothing?
If Google rejects a removal request, rebuild the case around one clear policy violation and proof Google can verify. The strongest follow-up is usually a tighter report under the Google Maps user-contributed content policy, not the same complaint sent again with the same unsupported claim.
The wrong move is repeated in-profile reporting from your Google Business Profile dashboard with no new material. That usually fails because Google’s review spam filtering and moderation systems have already seen the original claim, and “this is fake” on its own gives them nothing to test. Rejection often comes down to weak evidence, the wrong policy category, or an allegation Google cannot verify from the review text and account signals available to it.
The better move is to preserve the record before you escalate. Save screenshots of the live review, the reviewer profile, timing, edits, and any account clues that point to a pattern; then pull your order records, CRM history, booking logs, staff rota, and location logs so you can show whether that person was ever a customer or even on site. If the issue is impersonation, conflict of interest, off-topic political content, or coordinated abuse, say that exact policy ground instead of filing it as a generic fake review.
The route then depends on the evidence. In-profile reporting is the lightest path and works when the breach is obvious from the content itself. A support thread is stronger when your Google Business Profile has a clear factual record to attach, while a legal removal request fits narrower cases such as court-backed defamation findings or privacy violations; rules vary by country and platform, so this is general information, not legal advice.
How do Google’s review rules set the line between spam, defamation, and content Google may still leave live?
Google will remove reviews that breach the Google Maps user-contributed content policy, but it can leave a review live even when you think it is unfair, harsh or commercially damaging because removability turns on a policy category first and jurisdiction-specific law second.
The wrong approach is treating every bad review as removable. That fails because Google’s review spam filtering and manual moderation look for prohibited content such as fake engagement, impersonation, off-topic rants, conflicts of interest, harassment or banned content categories, not simple disagreement about service quality. In BGR Review’s dataset of negative review cases with prior self-filed attempts, logged June 2025 to June 2026, roughly 90% of businesses came to us after using only the in-platform report button with no supporting documentation, and 70–80% of those initial requests had been rejected. A rejection did not prove the review was genuine.
The better approach is matching the review to the exact policy or legal issue. Undisclosed paid endorsements fall under the US FTC’s rules on endorsements and testimonials; false factual claims can raise defamation questions; misleading commercial practices can trigger UK or EU consumer-protection issues. Country and platform rules differ, so this is general information, not legal advice.
How do you strengthen Google Business Profile trust after the study points to weak review signals?
Strengthen Google Business Profile trust by fixing profile completeness, earning steady legitimate reviews, and making response habits consistent. Trust usually improves faster when your profile basics and review pattern stop sending mixed signals across locations.
The wrong move is chasing volume before the profile is believable. If your primary category is loose, service details are thin, photos are stale, and owner responses swing from thoughtful at one branch to absent at another, extra reviews often do less for local pack visibility and click-through rate than you expect because the profile still looks uneven.
Start with the parts you control in the Google Business Profile dashboard: tighten the main category, trim duplicate or irrelevant services, add recent job or location photos, and set a response rule your team can actually keep. In BGR Review's dataset of 1,485 businesses observed February–July 2026, new trades and local service businesses that reached 20–30 reviews over the first three months were associated with improved local visibility, but that lift sat alongside other ranking factors rather than replacing them.
Request reviews from real customers at natural completion moments: job signed off, invoice paid, booking completed, issue resolved. Bursts look synthetic, especially when review text quality is thin and all posts land inside a narrow window; a steady flow gives Google cleaner trust signals and gives prospects better reasons to call or book.
For franchises, standardise the audit cadence and keep the local context in the reply. Multi-location consistency should cover categories, services, photo freshness and response timing, while owner responses still mention the actual branch, staff member or job type so each location earns trust on its own terms. If you want outside help with review growth, BGR Review sells review packages with a 30-day free replacement guarantee, but profile hygiene is the cheaper fix when the basics are still weak.
Where to go from here
Start with a three-part audit: review text quality, review recency and policy risk on the same sheet. That shows you where the real return sits. A stale profile with a solid star average usually needs fresh, specific reviews and tighter request timing to lift map-pack click-through rate and calls; a profile hit by clear policy breaches needs evidence first, because one unresolved fake or abusive review can depress conversions even when local pack visibility holds.
If you find policy issues, move straight to the Google review removal service page and check the workflow before you file anything. The practical expectation is simple: you should end up with a cleaner submission route, a stronger evidence pack and a clearer yes-or-no on whether escalation is worth the effort.